How to Make an Inventory Spreadsheet in Excel in 8 Steps
Build an Excel inventory spreadsheet with an item list, movement log, SUMIFS stock formula and reorder flag. See where a simple file needs more.
By Ultimate Inventory Tracker by Cosmo Suite · Editorial policy
Published · 7 min read
You can make an inventory spreadsheet in Excel with two tables: an item list and a movement log. A SUMIFS formula adds the movements for each item, so the stock figure comes from recorded changes instead of repeated edits.
Start with the items you actually sell or use. Then add each sale, delivery, or correction as a row. The example below uses a small soap-and-candle maker with three places to hold stock. It shows the basic build, then the point where a home-made sheet needs more than one total.
In Short: keep item details in one Excel table and stock movements in another. Give every item a stable code, record quantity changes with a positive or negative sign, and calculate stock from the log.
Build the item list and movement log
An inventory spreadsheet needs one row per item and a second table for changes to stock. Keep descriptive details in the first table; keep dated events in the second. Keep the lists apart. Then you can add a sale without erasing the earlier count, and trace each total back to its source row.
An item table is the short list of products and supplies you hold. It keeps each item code, unit, opening count, and reorder level together.
1. Create an Items table
Open a blank workbook and add a sheet named Items. Make these columns:
| Item | Code | Unit | Opening stock | Reorder level | Place |
|---|---|---|---|---|---|
| Lavender soap bar | SOAP-LAV | each | 24 | 6 | Shop |
| Soy wax | WAX-SOY | oz | 160 | 32 | Supplies shelf |
Choose a short code that stays the same when you rename an item. If you sell sizes or colours, give each variant its own code. Avoid using row numbers as codes because sorting the table changes row order.
Select the range and choose Format as Table. Name it Items in the Table Design tab. Excel references such as [@Item] expand when you add rows, so you do not need to adjust formula ranges by hand. Microsoft's table guide shows how to create one. Its structured reference guide explains how table names and column names work in formulas.
2. Make a Movements table
Add a second sheet called Movements. Use columns for Date, Item, Type, Quantity Change, Place, and Note. Create another Excel table and name it Movements.
A movement log is a dated record of each event that changes a quantity. It preserves the reason for the current count and makes corrections visible.
Use a positive quantity when stock comes in and a negative quantity when it goes out. A delivery of 40 oz of wax is 40; using 12 oz in a batch is -12. A sale of three bars is -3. This signed-number method lets the stock formula add the log without separate in and out calculations. Microsoft explains that calculated columns fill a table formula down its rows in its Excel table guide.
Keep one event per row. Do not put three sales in one cell or erase an old movement after a correction. If a count is wrong, enter an adjustment row with the difference and a short reason.
Add stock and reorder formulas
On-hand stock is the opening quantity plus every recorded change for that item. A reorder status then compares the result with a threshold you choose. Formulas can total and flag entries, but they cannot record a sale you never enter. The log only works when each row uses the item code consistently.
3. Calculate movement total
On the Items table, add a column named Movement Total. Enter:
=SUMIFS(Movements[Quantity Change],Movements[Item],[@Item])
This adds Quantity Change only when the movement Item matches the current row. Check each entry against the item list. A typo becomes a separate name, so Excel leaves that quantity out.
4. Calculate On Hand
Add an On Hand column:
=[@[Opening stock]]+[@[Movement Total]]
For the soap bar above, an opening count of 24 and a logged sale of three gives 21 on hand. The original count remains visible, and the movement row explains the change.
If your Excel version uses semicolons between formula arguments, replace the commas with semicolons. Formula names and separators can vary with regional settings.
5. Flag items to check
Add a Status column:
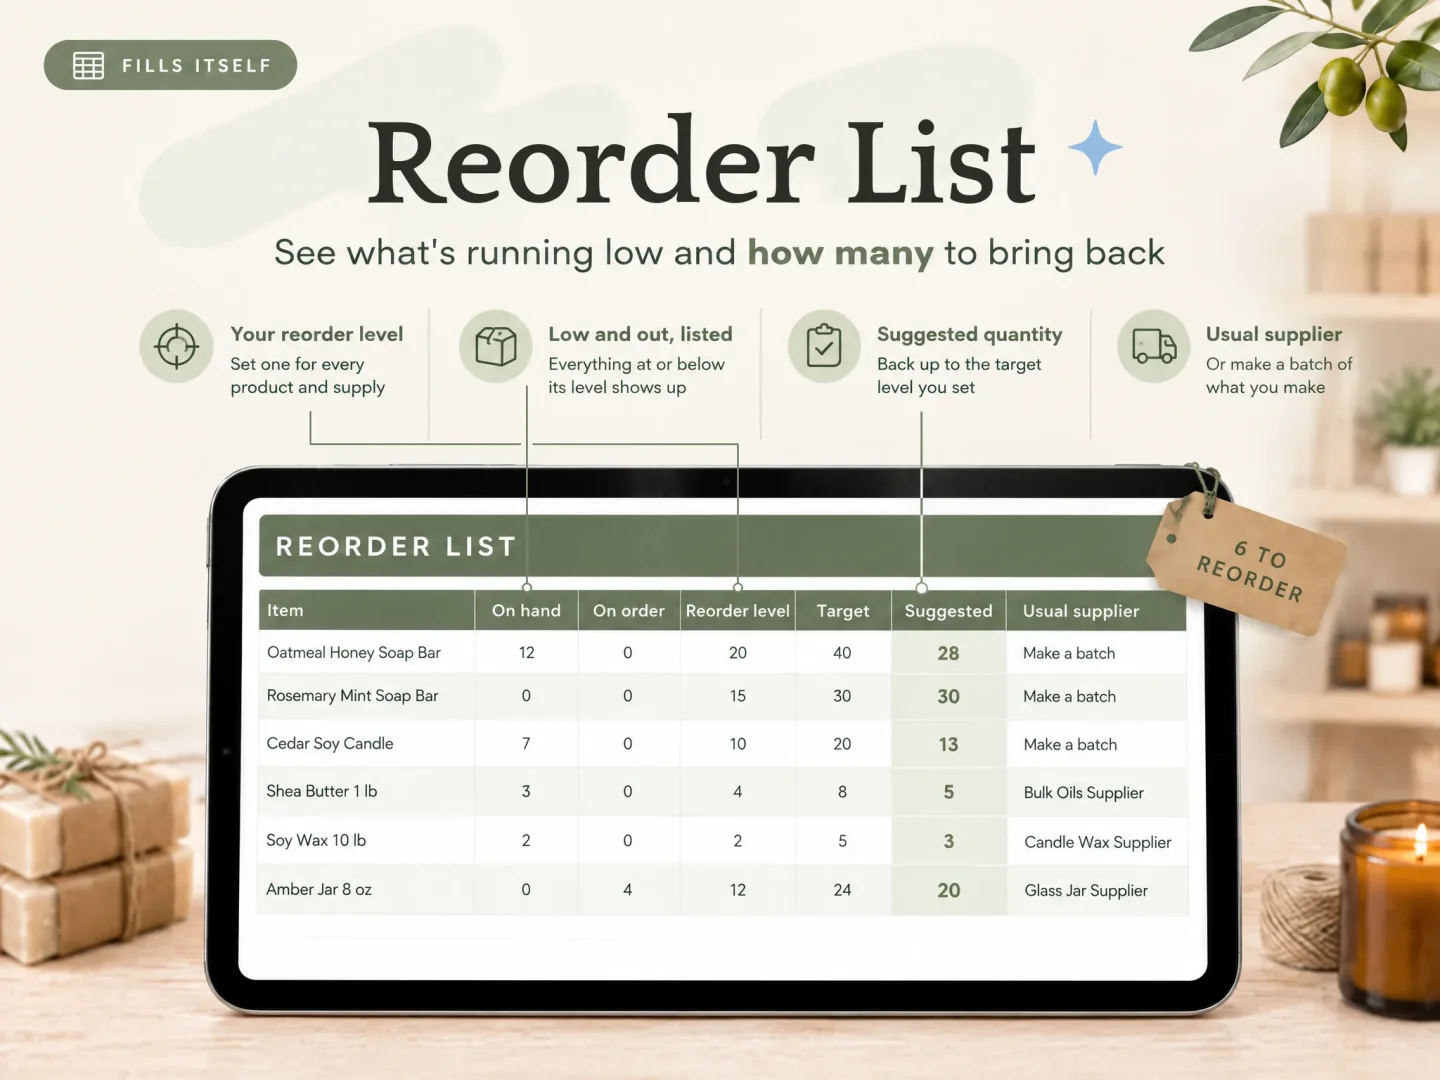
=IF([@[On Hand]]<=[@[Reorder level]],"Running low","In stock")
Select the Status column and use Conditional Formatting to highlight Running low. This is a visible flag in the workbook. It is not an email or phone notification, and it does not place an order for you.
Excel inventory spreadsheet: what to use when
A useful sheet keeps the original count, later movement rows, and current total in separate places. The maker's month below is an illustrative workbook scenario, not customer results. Start with one item and one movement, then add the rows you need. Choose the simplest setup that can answer where each count came from.
6. Work through one maker's month
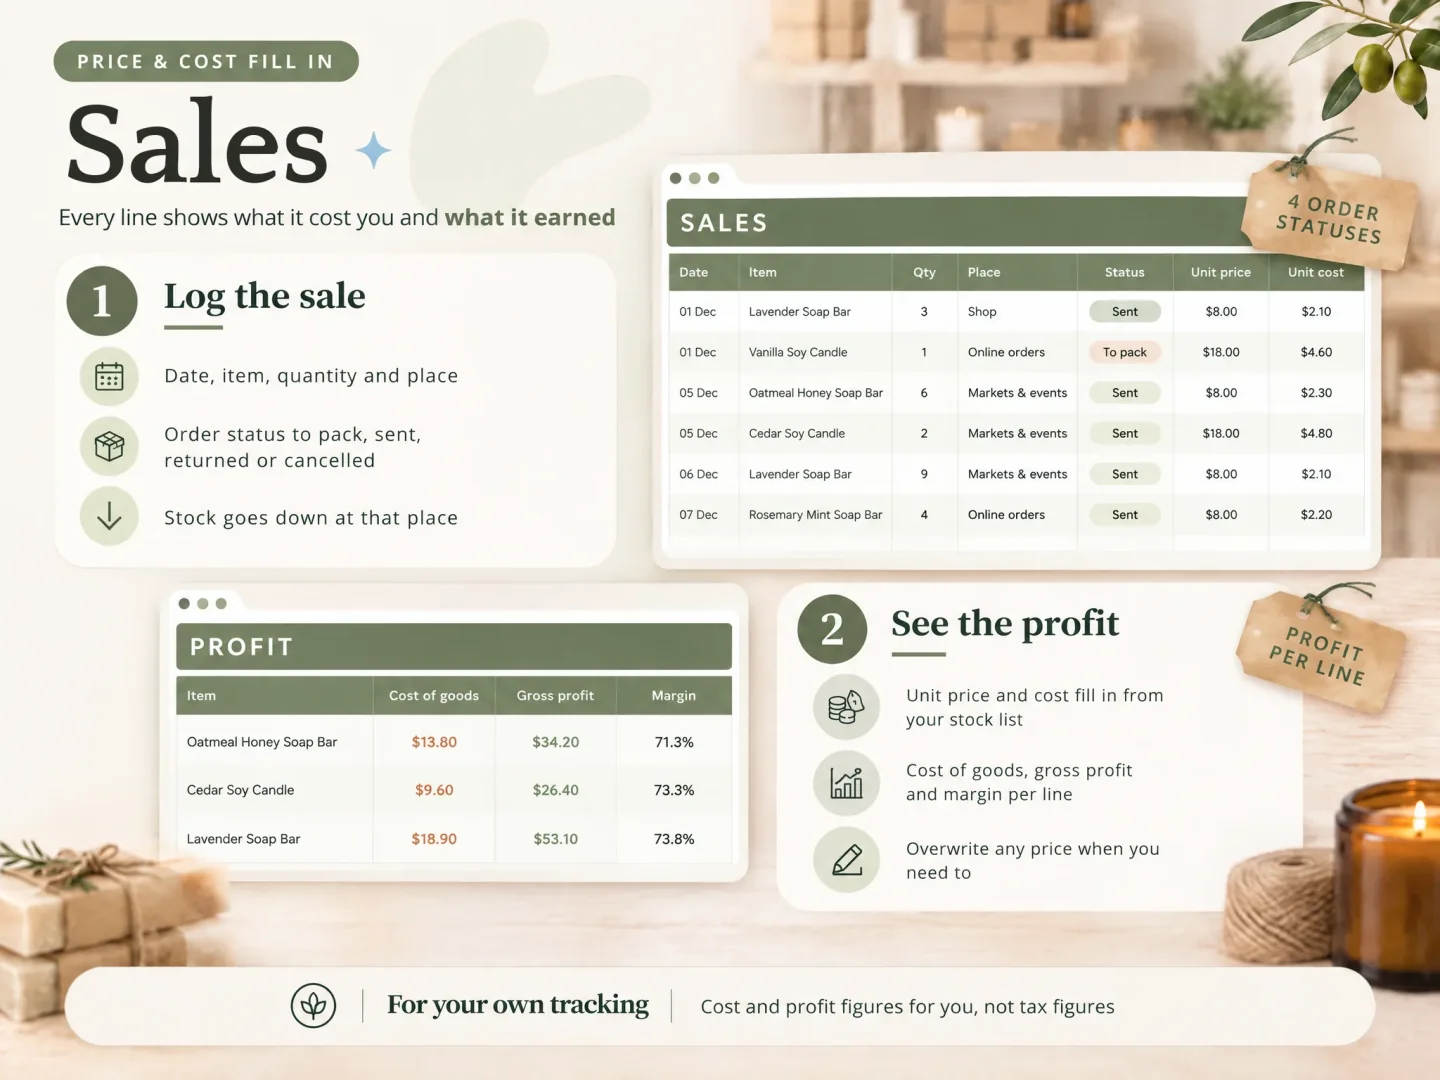
A soap-and-candle maker tracks 24 products and supplies in three places: Shop, Online orders, and Markets & events. Over the month, the maker logs 41 sales and two batches: 24 soap bars and 18 candles. These figures describe the example only.
Suppose a sale row records three lavender bars sold at the Shop. The movement is -3, the place is Shop, and the note can carry the order reference the seller uses. On Hand falls by three because the formula includes that row. A separate count for each place needs the Place field in the calculation too; a single total will not tell you which place holds the remaining bars.
For a batch of 24 soap bars, the finished-bar quantity goes up and the oils and other supplies used go down. A basic one-log sheet can record both sides as movement rows. If you make products regularly, add a recipe table that records supplies per finished piece, then record each batch against that recipe.
7. Add a place-specific total if you need one
For stock held in several places, the formula needs both an item and a place condition. One approach is to create a summary with an item in A2 and a place in B1, then use:
=SUMIFS(Movements[Quantity Change],Movements[Item],$A2,Movements[Place],B$1)
Add the opening quantity to the right place, too. Transfers need two records: a negative quantity at the place stock leaves and a positive quantity at the place it reaches. If you sell at a counter and in an online shop, the spreadsheet does not connect to either channel or scan barcodes. You log or paste each sale yourself.
Check what your sheet can answer
A home-made workbook works when you can keep its lists and formulas consistent. Before relying on it, test one purchase, one sale, one adjustment, and a transfer. If you need a feature the workbook cannot support, pick a different setup instead of hiding that gap with another formula.
8. Test the sheet before using it
Try these checks with sample rows:
- Add a purchase and confirm On Hand rises by that quantity.
- Add a sale with a negative quantity and confirm On Hand falls.
- Change the item's reorder level and confirm the Status changes at the right point.
- Add a transfer out and a matching transfer in, then confirm the two place totals.
- Sort the item table and confirm the formulas still refer to the right item.
- Enter an adjustment with a reason and make sure it changes the total once.
Microsoft's inventory template gallery includes an “Inventory list with reorder highlighting.” Its inventory spreadsheet overview describes an inventory spreadsheet as a structured list of items, quantities, and related details. Look at each template's columns and formulas before you build around it; templates vary in what they calculate.
| Use this setup | When it fits | What to check |
|---|---|---|
| Plain item list | You need a current count for a cupboard or one shelf | Who will update the quantity after each change? |
| Excel table and movement log | You can record each sale, purchase, and correction | Do formulas match item codes and places? |
| A linked inventory file | You want sales, supplies, batches, and places connected | Does it cover the entries you actually make? |
| Inventory app | You need barcode scanning or a shop connection | Does it support your selling channels and team? |
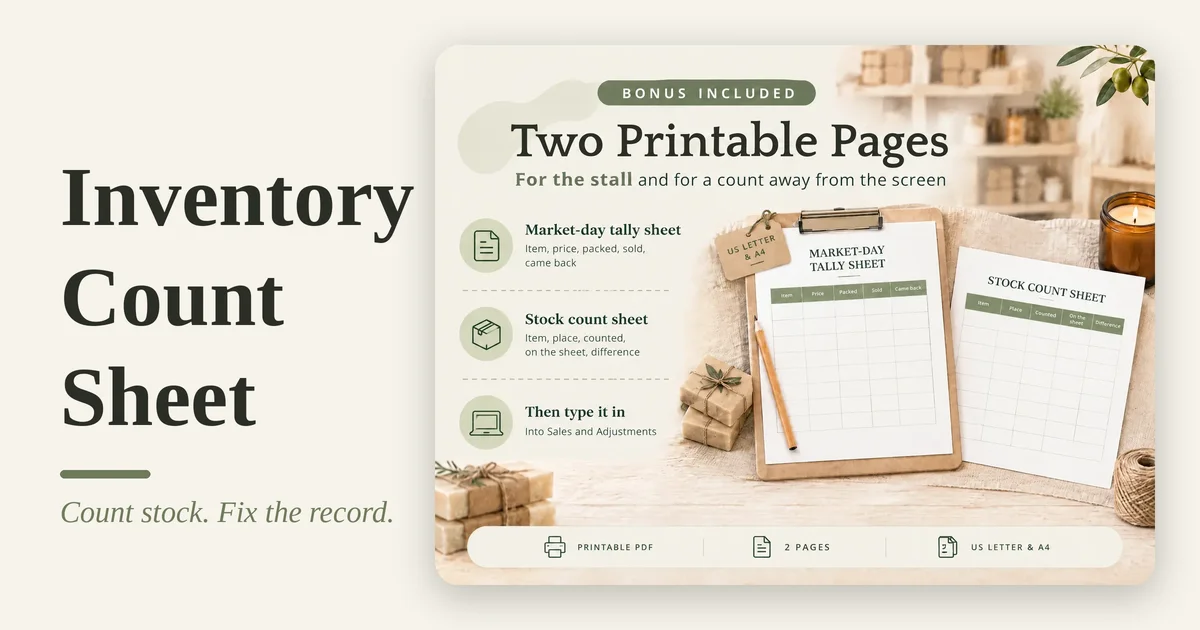
If you want a finished list-and-log structure, the inventory spreadsheet guide shows the columns and moving count behind a small seller's file. The Ultimate Inventory Tracker includes one Google Sheets file and one Excel file with the same 12 connected tabs, plus printable count and market tally pages. It costs $9 once. It does not connect to an online shop or till and does not scan barcodes; you log or paste each sale. See the file details before choosing it.
The manual build is a good way to learn what each column does. The main upkeep is keeping codes consistent and entering every movement. If the same sale needs to be typed into several totals, simplify the log before adding more formulas. Our About page explains who maintains the tracker, and our editorial policy explains how we check product and source claims. Questions about the file? Contact support@ultimateinventorytracker.site.
Frequently asked questions
How do I create an inventory spreadsheet in Excel?
Make an Items table for each product and a separate Movements table for every purchase, sale, or adjustment. Use SUMIFS to total movement quantities by item, then compare the result with a reorder level. Keep the opening count and every later change visible instead of typing over the current count.
What formula should I use for inventory in Excel?
If your Movements table has an Item column and a signed Quantity Change column, use =SUMIFS(Movements[Quantity Change],Movements[Item],[@Item]) for the movement total. Add opening stock to that result if your log starts after the first count.
How do I highlight low stock in Excel?
Add a Status column with =IF([@On Hand]<=[@Reorder Level],"Running low","In stock"). You can then use conditional formatting to colour the Running low result. The formula shows a status in the file; it does not send an alert.
Can Excel update inventory when I make a sale?
It can recalculate from a sale row you enter or paste into the movement log. Excel does not know about a sale in your online shop or at a till by itself, so you still need to log or paste each sale.
Can I track inventory in more than one place in Excel?
Yes. Add a Place column to each sale, purchase, transfer, and count record, then calculate totals for each item and place. You must record the right place on each row; a spreadsheet does not sync stock with a shop or till.
When should I use an inventory template instead of building one?
Use a template when you want linked tabs and formulas without building and checking them yourself. A ready file can also include supplies, batches, and stock by place. Choose an app if you need barcode scanning or a live shop connection.
Sources
Keep reading
Inventory Spreadsheets
Inventory Spreadsheet: The Columns You Need and How to Stop Updating Stock by Hand
Inventory spreadsheet: the 9 columns to set up first, the formulas that keep stock on hand right, and a maker's month worked through 41 sales and 2 batches.
· 9 min read
Inventory Spreadsheets
Inventory Count Sheet: Count Stock and Fix the Record
Inventory count sheet: how to record a count and update stock quantities. Count one place at a time, check differences, and log a dated adjustment.
· 8 min read

Inventory Spreadsheets
Inventory List Template: The Columns a Small Seller Needs
Inventory list template: start with a clean count, then add fields that help you spot low stock, compare variants, and plan a sensible restock.
· 8 min read
